
那么让我们开始吧......
LPR 有时称为 ALPR(自动车牌识别),有 3 个主要阶段。
- 车牌检测:这是系统的第一个阶段,也可能是最重要的阶段。正是在这个阶段,确定了车牌的位置。此阶段的输入是车辆的图像,输出是车牌。
- 字符分割: 在这个阶段,车牌上的字符被映射出来并分割成单独的图像。
- 字符识别:这是我们总结的地方。此处标识了前面分段的字符。为此,我们将使用机器学习。
理论已经讲得够多了,我们可以开始编码了吗?
当然,让我们准备一下环境。我们需要做的第一件事是创建一个虚拟环境。这使得管理我们的项目依赖项和包变得容易。您可以使用 virtualenv 包创建虚拟环境。
# install virtualenv if you don’t have the package already
pip install virtualenv
mkdir license-plate-recognition
cd license-plate-recognition
virtualenv lpr
source lpr/bin/activate
现在,名为 lpr 的文件夹应该位于您的项目目录中。
现在,让我们安装我们的第一个软件包 scikit-image。它是一个用于图像处理的 Python 包。要安装它,请运行。
pip install scikit-image该软件包的一些关键依赖项是 scipy (用于一些复杂的科学计算)、numpy (用于 n 维数组作)和 matplotlib (用于绘制图形和显示图像)。另一个重要的包是 Pillow — 一个 python 图像库。
车牌检测 (车牌定位)
这是第一阶段,在这个阶段结束时,我们应该能够识别车牌在汽车上的位置。为此,我们需要读取图像并将其转换为灰度。在灰度图像中,每个像素都在 0 到 255 之间。我们现在需要将其转换为二进制图像,其中像素要么是完全黑色的,要么是白色的。
注意: 如果您在 mac-os 上使用 matplotlib 时遇到问题,请按照此说明进行作。
以下代码的输出将显示两个图像,一个是灰度图像,另一个是二进制图像。
from skimage.io import imread
from skimage.filters import threshold_otsu
import matplotlib.pyplot as plt

car_image = imread("car.jpg", as_gray=True)
# it should be a 2 dimensional array
print(car_image.shape)

# the next line is not compulsory however, a grey scale pixel
# in skimage ranges between 0 & 1. multiplying it with 255
# will make it range between 0 & 255 (something we can relate better with

gray_car_image = car_image * 255
fig, (ax1, ax2) = plt.subplots(1, 2)
ax1.imshow(gray_car_image, cmap="gray")
threshold_value = threshold_otsu(gray_car_image)
binary_car_image = gray_car_image > threshold_value
ax2.imshow(binary_car_image, cmap="gray")
plt.show()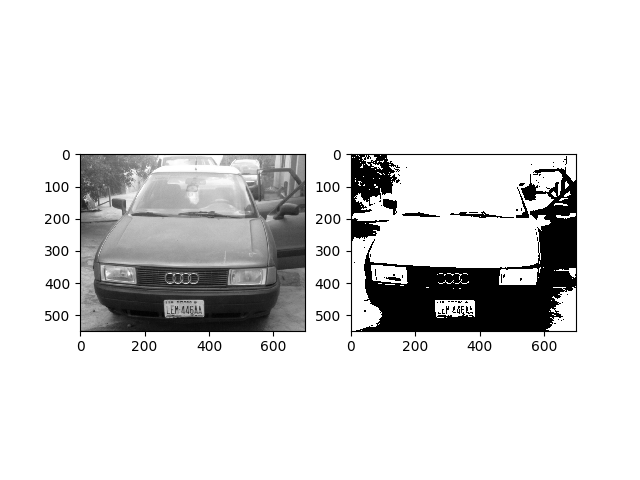
我们需要使用连通分量分析 (CCA) 的概念来识别图像中的所有连通区域。还可以探索其他方法,如边缘检测和形态处理。CCA 基本上可以帮助我们在前台对连接的区域进行分组和标记。如果一个像素具有相同的值并且彼此相邻,则认为它们已连接到另一个像素。
from skimage import measure
from skimage.measure import regionprops
import matplotlib.pyplot as plt
import matplotlib.patches as patches
import localization

# this gets all the connected regions and groups them together
label_image = measure.label(localization.binary_car_image)
fig, (ax1) = plt.subplots(1)
ax1.imshow(localization.gray_car_image, cmap="gray");

# regionprops creates a list of properties of all the labelled regions
for region in regionprops(label_image):
    if region.area < 50:
        #if the region is so small then it's likely not a license plate
        continue

    # the bounding box coordinates
    minRow, minCol, maxRow, maxCol = region.bbox
    rectBorder = patches.Rectangle((minCol, minRow), maxCol-minCol, maxRow-minRow, edgecolor="red", linewidth=2, fill=False)
    ax1.add_patch(rectBorder)
    # let's draw a red rectangle over those regions

plt.show()我们必须导入前一个文件,以便我们可以访问那里的值。measure.label 方法用于映射二进制图像中的所有连接区域并标记它们。在标记的图像上调用 regionprops 方法将返回所有区域及其属性(如 area、bounding box、label 等)的列表。我们用了补丁。Rectangle 方法在所有映射区域上绘制矩形。
从生成的图像中,我们可以看到其他不包含车牌的区域也被映射了。为了消除这些,我们将使用典型车牌的一些特性来去除它们。
- 它们的形状是矩形的。
- 宽度大于高度。
- 车牌区域宽度与完整图像的比例范围在 15% 到 40% 之间。
- 车牌区域高度占完整图像的比例在8%到20%之间。
如果这些特性不适用于您的车牌形状,请不要犹豫(尽管可能性很低)。
from skimage import measure
from skimage.measure import regionprops
import matplotlib.pyplot as plt
import matplotlib.patches as patches
import localization

# this gets all the connected regions and groups them together
label_image = measure.label(localization.binary_car_image)

# getting the maximum width, height and minimum width and height that a license plate can be
plate_dimensions = (0.08*label_image.shape[0], 0.2*label_image.shape[0], 0.15*label_image.shape[1], 0.4*label_image.shape[1])
min_height, max_height, min_width, max_width = plate_dimensions
plate_objects_cordinates = []
plate_like_objects = []
fig, (ax1) = plt.subplots(1)
ax1.imshow(localization.gray_car_image, cmap="gray");

# regionprops creates a list of properties of all the labelled regions
for region in regionprops(label_image):
    if region.area < 50:
        #if the region is so small then it's likely not a license plate
        continue

    # the bounding box coordinates
    min_row, min_col, max_row, max_col = region.bbox
    region_height = max_row - min_row
    region_width = max_col - min_col
    # ensuring that the region identified satisfies the condition of a typical license plate
    if region_height >= min_height and region_height <= max_height and region_width >= min_width and region_width <= max_width and region_width > region_height:
        plate_like_objects.append(localization.binary_car_image[min_row:max_row,
                                  min_col:max_col])
        plate_objects_cordinates.append((min_row, min_col,
                                              max_row, max_col))
        rectBorder = patches.Rectangle((min_col, min_row), max_col-min_col, max_row-min_row, edgecolor="red", linewidth=2, fill=False)
        ax1.add_patch(rectBorder)
    # let's draw a red rectangle over those regions

plt.show()
从 cca.py 脚本的修订版本中,将消除可能不是车牌的其他区域。但是,某些看起来与车牌一模一样的区域(前照灯、贴纸等)仍有可能也被标记。要消除这些其他区域,我们需要进行垂直投影。该概念是通过添加每列中的所有像素来实现的。假设车牌区域将具有大量像素值,因为车牌区域上写有字符。
字符分割
这是我们绘制车牌上所有字符的阶段。我们在这里也将使用 CCA 的概念。
import numpy as np
from skimage.transform import resize
from skimage import measure
from skimage.measure import regionprops
import matplotlib.patches as patches
import matplotlib.pyplot as plt
import cca2

# on the image I'm using, the headlamps were categorized as a license plate
# because their shapes were similar
# for now I'll just use the plate_like_objects[2] since I know that's the
# license plate. We'll fix this later

# The invert was done so as to convert the black pixel to white pixel and vice versa
license_plate = np.invert(cca2.plate_like_objects[2])

labelled_plate = measure.label(license_plate)

fig, ax1 = plt.subplots(1)
ax1.imshow(license_plate, cmap="gray")
# the next two lines is based on the assumptions that the width of
# a license plate should be between 5% and 15% of the license plate,
# and height should be between 35% and 60%
# this will eliminate some
character_dimensions = (0.35*license_plate.shape[0], 0.60*license_plate.shape[0], 0.05*license_plate.shape[1], 0.15*license_plate.shape[1])
min_height, max_height, min_width, max_width = character_dimensions

characters = []
counter=0
column_list = []
for regions in regionprops(labelled_plate):
    y0, x0, y1, x1 = regions.bbox
    region_height = y1 - y0
    region_width = x1 - x0

    if region_height > min_height and region_height < max_height and region_width > min_width and region_width < max_width:
        roi = license_plate[y0:y1, x0:x1]

        # draw a red bordered rectangle over the character.
        rect_border = patches.Rectangle((x0, y0), x1 - x0, y1 - y0, edgecolor="red",
                                       linewidth=2, fill=False)
        ax1.add_patch(rect_border)

        # resize the characters to 20X20 and then append each character into the characters list
        resized_char = resize(roi, (20, 20))
        characters.append(resized_char)

        # this is just to keep track of the arrangement of the characters
        column_list.append(x0)

plt.show()
plate_like_objects 是汽车上看起来像车牌的所有区域的列表。从我使用的图像中,三个区域被确定为车牌的候选项。为了节省时间,我对索引 2 进行了硬编码,因为这是带有车牌的索引。我将共享的最终代码将包含车牌验证技术,以消除实际上不包含车牌的其他区域。
然后在车牌上完成 CCA,并将每个字符的大小调整为 20 像素 x 20 像素。这样做是因为下一个阶段与角色的识别有关。
为了跟踪字符的顺序,引入了 column_list 变量来记下每个区域的起始 x 轴。然后可以对其进行排序以了解字符的正确顺序。
字符识别
这将是最后一个阶段,在这个阶段,我们引入了机器学习的概念。机器学习可以简单地定义为 AI 的一个分支,它处理数据并对其进行处理以发现可用于未来预测的模式。机器学习的主要类别是监督学习、无监督学习和强化学习。监督式学习利用已知的数据集(称为训练数据集)进行预测。我们将走监督学习的道路,因为我们已经对 As、B 和所有字母的样子有所了解。监督学习可分为两类;分类和回归。字符识别属于分类类别。
我们现在需要做的就是获取训练数据集,选择监督学习分类器,训练模型,测试模型并查看其准确性,然后使用该模型进行预测。
让我们从训练模型开始。我有两个不同的数据集,一个是 10 像素 x 20 像素,另一个是 20 像素 x 20 像素。我们将使用 20px x 20px,因为我们已经将每个字符的大小调整为该大小。除 O 和 I 之外的每个字母(典型的尼日利亚车牌没有这些字母,因为它们与 0 和 1 相似)都有 10 个不同的图像。
我们可以使用几个分类器,每个分类器都有其优点和缺点。我们将使用 SVC (support vector classifiers) 来完成此任务。我选择使用 SVC,因为它为我提供了最佳性能。但是,这并不一定意味着 SVC 是最好的分类器。
我们必须为这个阶段安装 scikit-learn 包。
pip install scikit-learnimport os
import numpy as np
from sklearn.svm import SVC
from sklearn.model_selection import cross_val_score
from sklearn.externals import joblib
from skimage.io import imread
from skimage.filters import threshold_otsu
letters = [
'0', '1', '2', '3', '4', '5', '6', '7', '8', '9', 'A', 'B', 'C', 'D',
'E', 'F', 'G', 'H', 'J', 'K', 'L', 'M', 'N', 'P', 'Q', 'R', 'S', 'T',
'U', 'V', 'W', 'X', 'Y', 'Z'
]
def read_training_data(training_directory):
image_data = []
target_data = []
for each_letter in letters:
for each in range(10):
image_path = os.path.join(training_directory, each_letter, each_letter + '_' + str(each) + '.jpg')
# read each image of each character
img_details = imread(image_path, as_gray=True)
# converts each character image to binary image
binary_image = img_details < threshold_otsu(img_details)
# the 2D array of each image is flattened because the machine learning
# classifier requires that each sample is a 1D array
# therefore the 20*20 image becomes 1*400
# in machine learning terms that's 400 features with each pixel
# representing a feature
flat_bin_image = binary_image.reshape(-1)
image_data.append(flat_bin_image)
target_data.append(each_letter)
return (np.array(image_data), np.array(target_data))
def cross_validation(model, num_of_fold, train_data, train_label):
# this uses the concept of cross validation to measure the accuracy
# of a model, the num_of_fold determines the type of validation
# e.g if num_of_fold is 4, then we are performing a 4-fold cross validation
# it will divide the dataset into 4 and use 1/4 of it for testing
# and the remaining 3/4 for the training
accuracy_result = cross_val_score(model, train_data, train_label,
cv=num_of_fold)
print("Cross Validation Result for ", str(num_of_fold), " -fold")
print(accuracy_result * 100)
current_dir = os.path.dirname(os.path.realpath(__file__))
training_dataset_dir = os.path.join(current_dir, 'train')
image_data, target_data = read_training_data(training_dataset_dir)
# the kernel can be 'linear', 'poly' or 'rbf'
# the probability was set to True so as to show
# how sure the model is of it's prediction
svc_model = SVC(kernel='linear', probability=True)
cross_validation(svc_model, 4, image_data, target_data)
# let's train the model with all the input data
svc_model.fit(image_data, target_data)
# we will use the joblib module to persist the model
# into files. This means that the next time we need to
# predict, we don't need to train the model again
save_directory = os.path.join(current_dir, 'models/svc/')
if not os.path.exists(save_directory):
os.makedirs(save_directory)
joblib.dump(svc_model, save_directory+'/svc.pkl')在上面的要点中,训练数据集中的每个字符都用于训练 svc 模型。还进行了 4 倍交叉验证以确定模型的准确性,然后将模型持久化到文件中,以便无需再训练模型即可进行预测。
现在我们有一个经过训练的模型,我们可以尝试预测我们之前分割的字符。
import os
import segmentation
from sklearn.externals import joblib

# load the model
current_dir = os.path.dirname(os.path.realpath(__file__))
model_dir = os.path.join(current_dir, 'models/svc/svc.pkl')
model = joblib.load(model_dir)

classification_result = []
for each_character in segmentation.characters:
    # converts it to a 1D array
    each_character = each_character.reshape(1, -1);
    result = model.predict(each_character)
    classification_result.append(result)

print(classification_result)

plate_string = ''
for eachPredict in classification_result:
    plate_string += eachPredict[0]

print(plate_string)

# it's possible the characters are wrongly arranged
# since that's a possibility, the column_list will be
# used to sort the letters in the right order

column_list_copy = segmentation.column_list[:]
segmentation.column_list.sort()
rightplate_string = ''
for each in segmentation.column_list:
    rightplate_string += plate_string[column_list_copy.index(each)]

print(rightplate_string)
注意
该系统最重要的事情之一是确保使用的图像清晰。还要确保图片的大小不要太大,600px 的宽度就足够了。如果您有任何疑问,请将其放在评论部分。谢谢
完整的应用程序可以在 https://github.com/femioladeji/License-Plate-Recognition-Nigerian-vehicles 上找到
Comments NOTHING